Last week, I created several rushing [charts](https://substack.com/@gfgsports) and they’ve received great feedback. This week, I’m diving into QB charts.
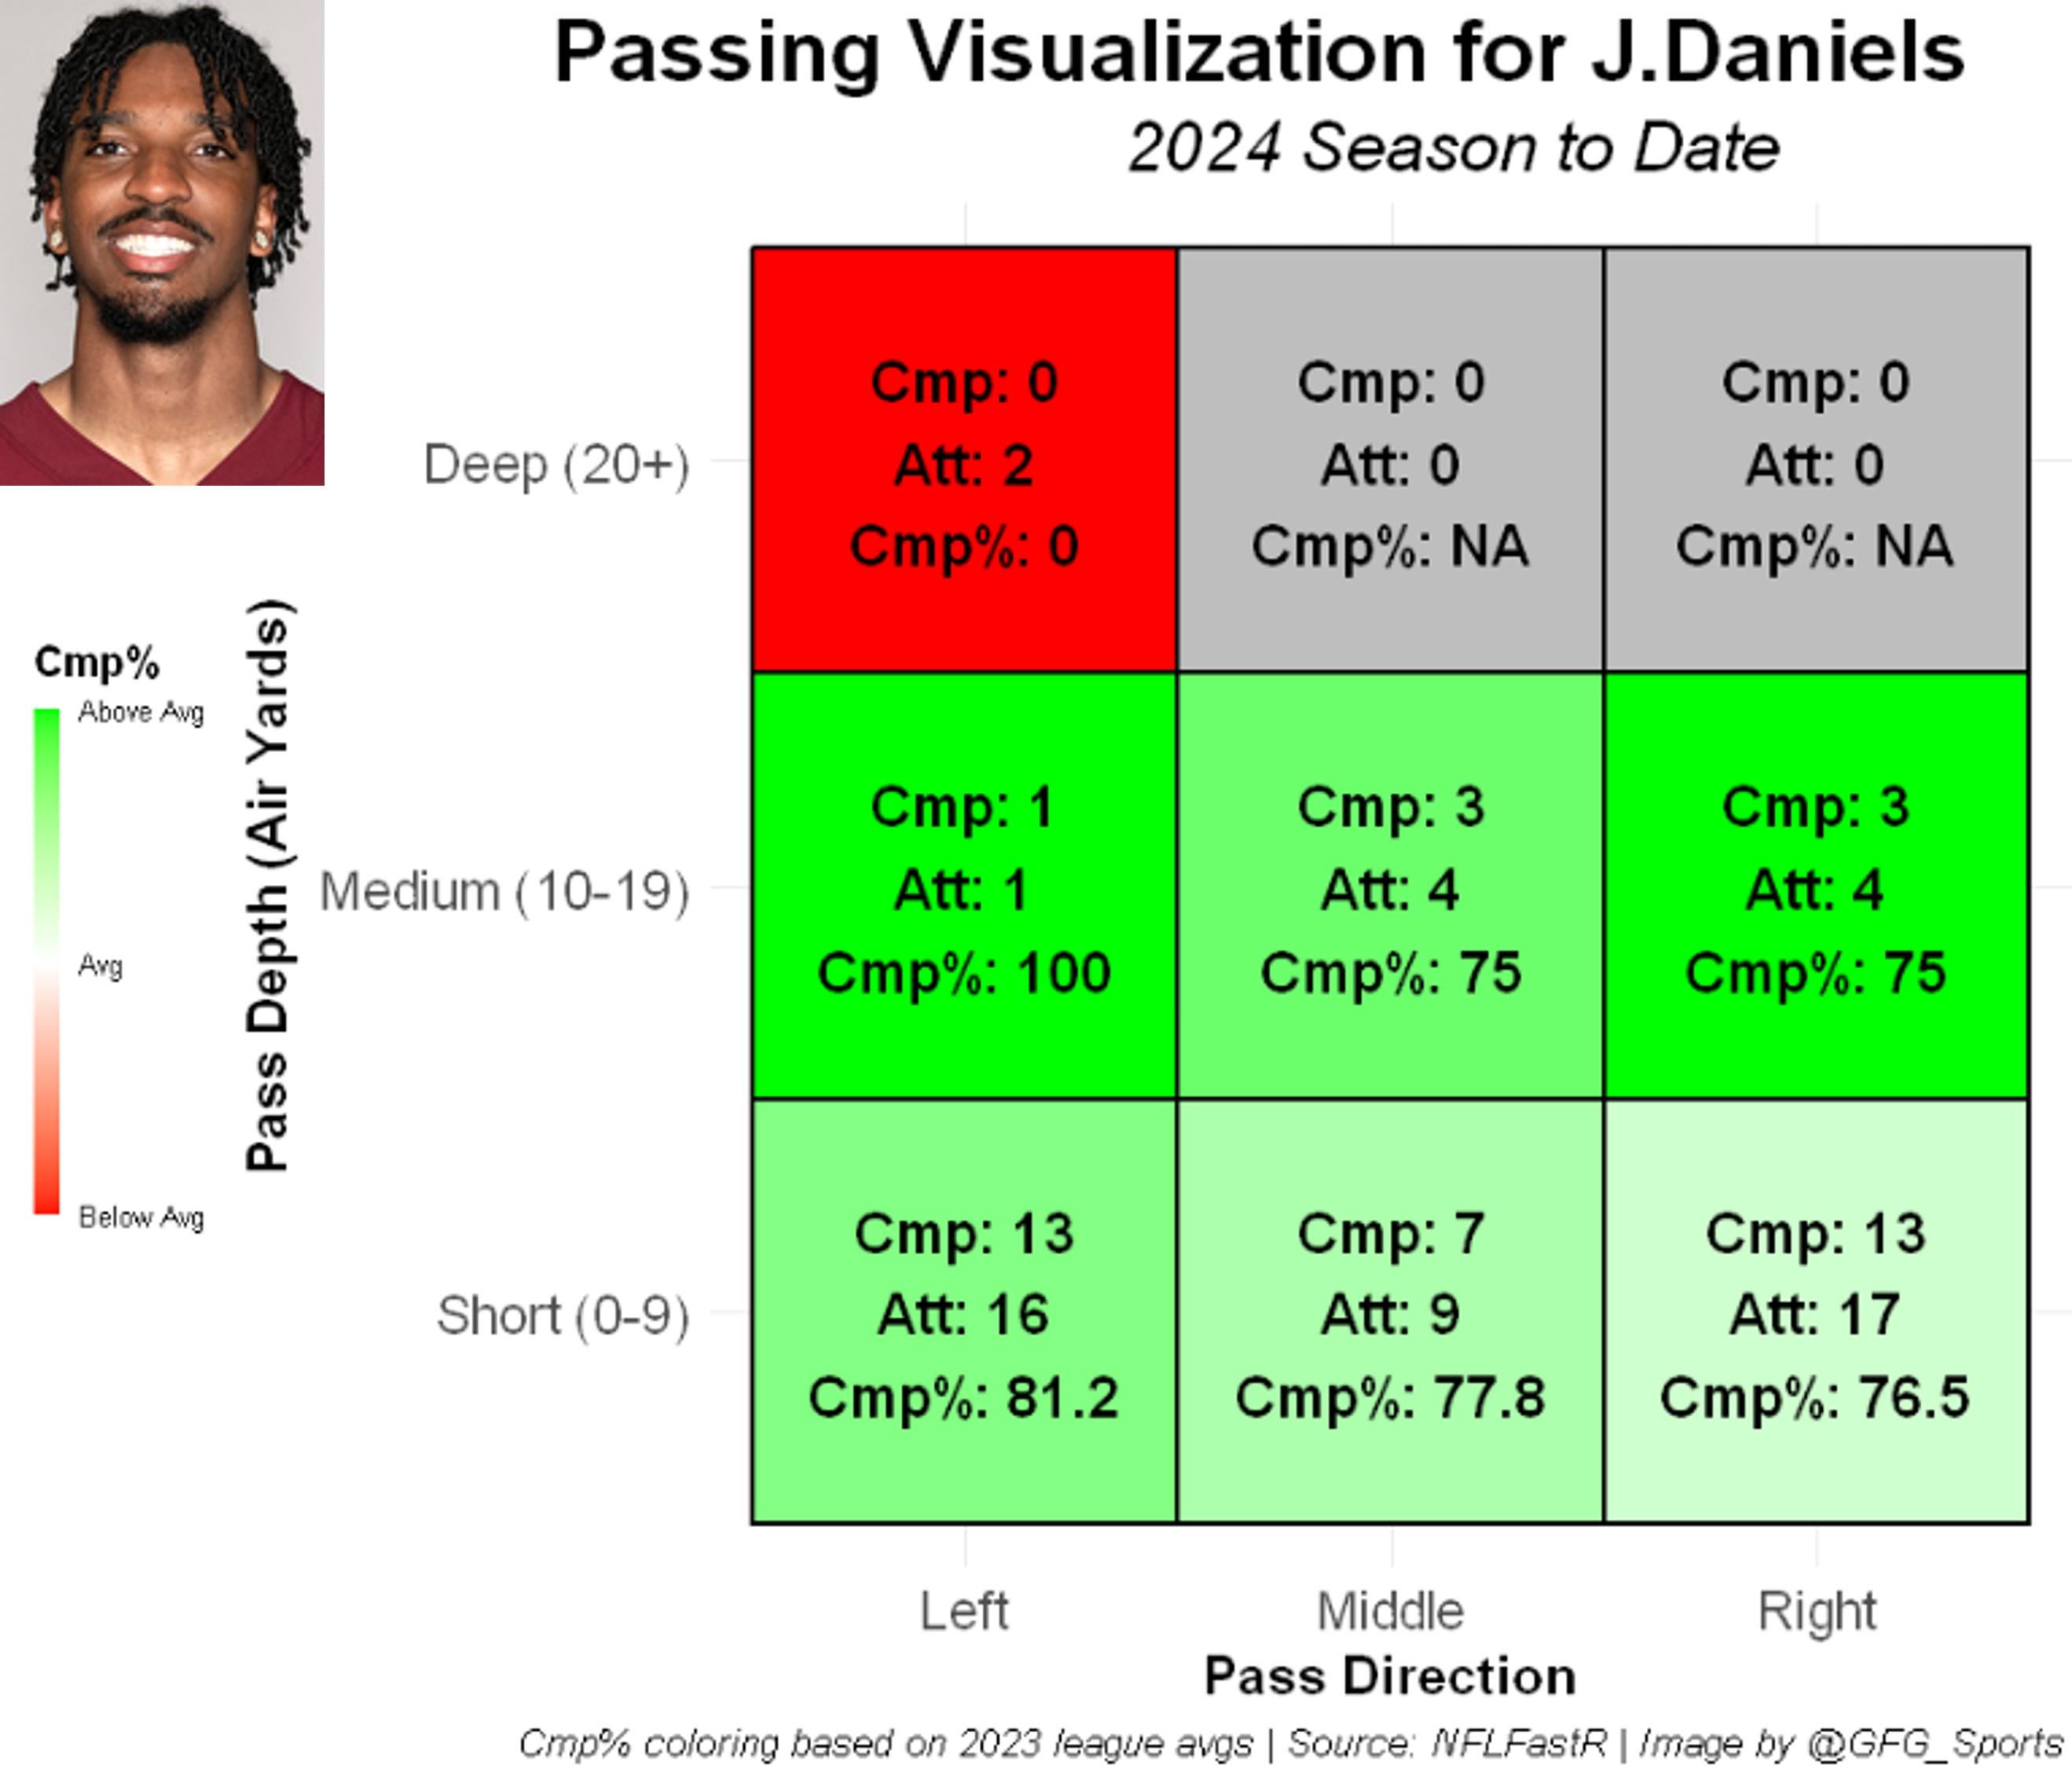
The field is divided into 9 segments based on pass direction (left, middle, and right) and passing depth (short, medium, and deep). Short’ is 0-9 yards, ‘medium’ is 10-19 yards, and ‘deep’ is 20+ yards. Note that these are air yards, meaning a screen pass that gains 50 yards after the catch would be recorded as only the distance it traveled in the air—around 2 yards, for example.
Each of the 9 segments displays three basic stats: completions, attempts, and completion percentage.
A perfectly white square indicates the completion percentage is exactly at the median of all passes thrown in 2023. The colors intensify as the completion percentage moves further away from the median—darker red for below average and darker green for above average.
Each segment’s color is based on the completion percentage relative to that specific segment’s median. For example, a 50% completion rate on deep middle passes will be green (above median), while the same rate on short middle passes will be red (below median).
This is my first attempt at this type of chart, so I’d really appreciate any feedback!
Show me this week 10. Then let’s talk.
I don’t know why so many people are worried after two games. Defenses are giving Daniels the short and intermediate routes so he’s throwing there. This shows great patience. It’s not like in college he never threw it deep, that’s actually what he was best known for. Receivers will feast when defenses start moving their safeties towards the line of scrimmage, or as Daniel’s becomes more comfortable taking a few deep shots into tight coverage.

3 comments
Last week, I created several rushing [charts](https://substack.com/@gfgsports) and they’ve received great feedback. This week, I’m diving into QB charts.
The field is divided into 9 segments based on pass direction (left, middle, and right) and passing depth (short, medium, and deep). Short’ is 0-9 yards, ‘medium’ is 10-19 yards, and ‘deep’ is 20+ yards. Note that these are air yards, meaning a screen pass that gains 50 yards after the catch would be recorded as only the distance it traveled in the air—around 2 yards, for example.
Each of the 9 segments displays three basic stats: completions, attempts, and completion percentage.
A perfectly white square indicates the completion percentage is exactly at the median of all passes thrown in 2023. The colors intensify as the completion percentage moves further away from the median—darker red for below average and darker green for above average.
Each segment’s color is based on the completion percentage relative to that specific segment’s median. For example, a 50% completion rate on deep middle passes will be green (above median), while the same rate on short middle passes will be red (below median).
This is my first attempt at this type of chart, so I’d really appreciate any feedback!
Show me this week 10. Then let’s talk.
I don’t know why so many people are worried after two games. Defenses are giving Daniels the short and intermediate routes so he’s throwing there. This shows great patience. It’s not like in college he never threw it deep, that’s actually what he was best known for. Receivers will feast when defenses start moving their safeties towards the line of scrimmage, or as Daniel’s becomes more comfortable taking a few deep shots into tight coverage.